Google Analytics Tracking Code

Thursday 8 December 2011

New Article: Crime analysis - exploiting geospatial datasets

We have just had an article published in GIS Professional magazine entitled "Crime analysis - exploiting geospatial datasets". You can read the article here.


Wednesday 30 November 2011

How do we get faculty/students to support students in spatial


We discussed the different ways that we could help faculty or students to support learning about spatial data/technologies. One of the main problems we discussed was how we could persuade faculty to adopt new technologies in their teaching. Here are some of our suggestions:

Show and Tell
Regular sessions to allow students and staff to demonstrate, to each other, some innovative geospatial tools or techniques they use – “a forum for showing off”. These could be held at lunchtime to fit with the timetables of people who are otherwise very busy. If there are other groups who already have these kinds of meetings, a geospatial expert could try to join them (a “friendly spy”) and present a session on geospatial technologies or data.

Hackathons
Along similar lines to show and tell sessions, we thought that one day workshops that group people together to work on a particular project could be a good way to teach geospatial technology. For example, the ‘Social Innovation Camp’ run day sessions that pair developers with non-developers to solve small problems.

Online Resources
We thought that online resources could have a large part to play in supporting geospatial learning, ranging from short video clips to an online tutoring system (similar to #geosciteach). We thought that it was particularly important that any online learning system didn’t look like a ‘traditional’ portal/VLE resource – if it looked more attractive and less like a university resource (and didn’t mention “scary” phrases like  “GIS”) it might be more attractive.

Drop-in sessions
It was suggested that drop-in sessions for students could be very beneficial, particularly if they were staffed by other paid students who might be more approachable than formal teaching staff. It is particularly useful to have students create their own material, so drop-in or show and tell sessions might be a good way to encourage this.

On the whole, our overall recommendation is to: create as many avenues as possible to allow people to get to geospatial information.

People in the group: Andy Hudson-Smith, Steven Gray, Gregory Marler, Nicola Osborne, Julie Sweetkind-Singer, Nick Malleson

Friday 11 November 2011

Final Product Post: A Review of the Project and Products

Table of Contents
  1. Introduction 
  2. Review of geospatial data
  3. User Needs Analysis
  4. Geospatial Methods 
  5. Data Outputs 
  6. The Added Value of GeoSpatial Data 
1. Introduction

Crime analysts and researchers in related fields could benefit substantially by using existing geospatial data (e.g. Open Street Map and Ordnance Survey MasterMap) but rarely make use of these datasets at present. This is due largely to the technical expertise required to obtain the data and analyse them spatially using complex geographical routines. This project has explored many novel data sources and manipulated them using geographical routines in order to generate new forms of spatial intelligence that can help to add value to the interpretation of recorded crime data. This post will summarise the methodology and results of the project as a whole. The following table provides a brief overview of our project outputs – full details about outputs are available here.

NameDescriptionLicenseDownload Location
GeoCrimeData Buildings - Leeds (version 2)OS MasterMap data showing buildings and some new information about them (distance from footpath, house type etc).Ordnance Survey Data Sub-Licence Agreementhttp://hdl.handle.net/10389/210
GeoCrimeData Road Accessibility - Leeds (version2)OS ITN road network data for Leeds with measures of integration.Ordnance Survey Data Sub-Licence Agreementhttp://hdl.handle.net/10389/209
GeoCrimeData Road Accessibility - GB (version 1)OpenStreetMap road network data for GB with measures of integration.Creative Commons Attribution-ShareAlike 2.0http://www.sharegeo.ac.uk/handle/10672/295


2. A Review of Geospatial Data

The first stage in the project was to review the range of geospatial data that could be used by the project. The full review is available here. We looked at a range of data sources, including those available as part of the data.gov scheme (a national programme of releasing  public  data to make government more  transparent), those produced by LandMap and the numerous Ordnance Survey (OS) datasets (some of which are publicly available and others which have restrictive licenses). Once we had determined what data were available we were able to conduct a user needs analysis in order to identify particular sources that could be useful to crime analysts.

3. User Needs Analysis

The project investigated current awareness and interest levels of geospatial data for crime analysis (particularly in understanding the distribution of domestic burglary) by engaging with potential end users. These included practitioners (for example police and community safety partners) and academics with research interests in this area. The potential needs and user requirements of spatial data for crime analysis were examined in two ways:
  • Through an online survey of academics and practitioners
  • Through a follow on one day Stakeholder Workshop of academics and practitioners
Both the online questionnaire and the results of the workshop were extremely illuminating and had a direct impact on the geospatial analysis that we performed. A full analysis of end users' needs is available here.

Following the results of the user needs analayis, we were able to focus on a smaller number of data sources which are best suited to providing the information in which the crime analysts were interested. The data we identified were two OS MasterMap products called the 'Integrated Transport Network' (a road network) and the 'Topography Layer' (which contains land and building features). In addition, we identified OpenStreetMap (OSM) data as an alternative source of road network data (see Figure 2). OSM has the advantage of being publicly available.

4. Geospatial Methods

Estimates of road 'business' in Scotland
Having identified the spatial attributes (i.e. data items) that crime analysts were interested in and the data that could be used to generate the new intelligence, we developed geospatial methods to analyse the data. The methods were implemented in a software package that is open source and freely available. For more information about the methods themselves, refer to the Geospatial Methods document.

Estimates of building type in Leeds
In terms of the road network data, vehicle or pedestrian traffic volume was identified as a factor that could influence crime patterns and hence the project estimated how accessible each street segment was (i.e. the stretches of road between junctions) by calculating each road's integration value. Integration is a mathematical measure that can be used to estimate how well connected a road is to the remainder of the road network which, interestingly, this has also been found to correlate with traffic volume.

With the building data, there were a number of features identified by the crime analysts that could increase or decrease a house’s risk of becoming a target of burglary. Although many factors must be left for future work, the project was able to calculate the density of buildings, the type of the house (detached, semi-detached, terraced or corner-terrace) and the distance to the nearest road or footpath. Each of these attributes can have an influence on crime risk.

5. Data Outputs

The outputs from the project have been uploaded into repositories and are available for download. The Data Outputs document has more details and also acts as a source of technical information about what the data comprise. Although the OpenStreetMap road network is publicly available, the buildings data can only be accessed by users of the Digimap Service who hold the appropriate Ordnance Survey licenses.

6. The Added Value of GeoSpatial Data

The final stage in the project was to identify how the data can be used to generate new information about what underpins crime patterns and inform crime analysis. For the full analysis, see the Added Value of Geospatial Data document. In terms of the building data, we calculated the number of burglaries in each property type and then examined how the property-specific burglary rates varied across different types of residential neighbourhood. These were identified with  a commonly used and freely available socio-demographic classification called the Output Area Classification. Interestingly, the risk of burglary in each property type varied substantially by the type of neighbourhood that the building was located in. For example, there were exceptionally low rates of burglary among terraced properties in Blue-Collar Communities and Prospering Suburbs all of which call for further investigation and, significantly, none of which would have been revealed using conventional burglary rates that fail to identify crime by house type and instead use a rate such as the number of burglaries per thousand houses.

To investigate how the road integration data might be used, we aggregated the integration values for all roads in an area and divided that by the number of roads to calculate a mean integration value (i.e. an average accessibility score). We then examined how burglary rates by house type varied across neighbourhoods with different levels of accessibility. We found a strong link between increasing levels of accessibility and burglary rates within detached houses (the busier the streets, the higher the burglary rate) which suggests that detached properties were much more vulnerable if they were in more accessible streets. For example, detached houses were over three times more likely to be burgled in the most accessible 10% of OAs compared with the least accessible 10%; a major difference indeed! Once again, these findings would not have emerged without bringing together different geospatial datasets.

Other Information

The team

Thursday 10 November 2011

Using Geospatial datasets for crime analysis: User needs and user requirements

'Geospatial data', can potentially be very useful in understanding crime patterns and in explaining why crime hotspots occur in particular places. However, the extent to which beneficiaries are aware that such data exists is largely unknown, and the added value that such data might bring is largely unexplored.

The GeoCrimeData project investigated current awareness and interest levels of geospatial data for crime analysis (particularly in understanding the distribution of domestic burglary) by engaging with potential end users. These included practitioners (for example police and community safety partners) and academics with research interests in this area. The potential needs and user requirements of geocrime data for crime analysis were examined in two ways
  • An online survey of academics and practitioners
  • A follow on one day Stakeholder Workshop of academics and practitioners
This blog entry summarises the findings from our user needs analysis. A more detailed report is available as an online document.

The online survey
80 stakeholders (academic and practitioner) who were involved in geospatial data and or burglary analysis were contacted and asked to complete an online survey. 33 respondents completed this questionnaire (40% response rate), and the respondents were almost a 50.50 split in terms of practitioner and academic respondents, about 60% worked in the UK and 40% in the US, 55% were male  and just over 50% were aged 36-50. Respondents were asked to identify three key factors in residential burglary and these are summarised in Table 1 below. A number of these have been developed as products for this project and they are highlighted with an asterisk (*) in the table.


Table 1. Understanding Domestic Burglary Hot Spots
Which of the following do you think are the three most important in understanding domestic burglary hotspots?Count
Prior burglary
18
Time of day
13
*Type of neighbourhood (affluent, mixed, disadvantaged)?
12
*Accessibility of the street (being able to enter and escape from the street easily)
12
*Street layout/design
9
Design of the property
9
Bordering a neighbourhood that is very different (e.g. a rich area bordering a poor area)
8
*Type of property (flat, bedsit, terrace, semi, detached)?
6
Social cohesion
5
*Visibility of the property from the road?
3
Housing Tenure
2
Being close to a parade of shops
2
Being close to a school
0
Other
Distance/proximity of/number of offenders living near
5
Area Management (burglary watch, estate management etc)
2
Alarms/Physical Security ofproperty
2
Landuse
1

In addition the respondents were presented with a series of six maps which showed examples of the use of different types of geospatial data for burglary analysis and they were asked specific questions about the utilities of each map. The main comments made were:
  • The hot spot map of burglary only provides a general overview of crime & needs more context to help understand and respond to crime
  • It is important to produce maps that show the timing of burglary offences
  • The maps could benefit from animation and hotspot benchmarking
  • The maps showing house types are useful but without statistical tables to accompany them they are of limited value
  • The complexity of the accessibility analysis was problematic for most crime analysts. The issue here is how this measure might be better communicated
  • Cross-referencing house type with accessibility and repeat victimisation was identified as a useful analysis to undertake
  • The domestic gardens map was perceived to be the least useful

The Stakeholder Workshop
Following on from the online survey, a one day Stakeholder Workshop was held in Central London with 12 persons who completed the survey (6 practitioners and 6 from academia). The purpose of this was to build on the survey results and to further explore what crime analysts might find useful in analysing and understanding domestic burglary (using geospatial datasets) and how the technical or administrative barriers to using such data can be overcome.

The key findings from the Stakeholders Workshop are summarised in Table 2.

Wednesday 9 November 2011

A Review of GeoSpatial Data Sources

Figure 1: MasterMap Topography Layer data
To determine which data sources could, potentially, be used to provide contextual information for crime analysis, we produced a review into a large number of geospatial data sources. The full review is available as an on-line document, this post will summarise our findings.

We looked at a range of data sources, including those available as part of the data.gov scheme, those produced by LandMap and the numerous Ordnance Survey (OS) datasets (some of which are publicly available and others which have restrictive licenses).

Figure 2: An example of OSM data (source).
The most useful data sets that we identified were two OS MasterMap products called the 'Integrated Transport Network' (a road network) and the 'Topography Layer' (which contains land and building features). Figure 1 provides an example of the Topography Layer.

In addition, we identified OpenStreetMap (OSM) data as an alternative resource for road network data (see Figure 2). OSM has the advantage of being publicly available.

The Added Value of Geospatial Data

Understanding crime patterns cannot be achieved just by looking at recorded crime data held by the police. You need information about all of the other influences on crime patterns that might have an affect. The good news is that much of the data about the geographical context of the crime or what we call the 'crime environment' is already available in the form of geospatial datasets. When we use these as well as crime data we can begin to see what's happening on the ground and the links between crime patterns and what shapes them.

The GeoCrimeData project has generated datasets about places produced from what we call the primary geospatial components of 'place'. These are referred to as polygons (e.g. areas/neighbourhoods), lines (e.g. roads) and points (e.g. houses). Our full analysis is available as an online document, and this post is a summary of the analysis.

House Type Analysis

The house type information has been produced by software created specifically for our project that examines the shapes of buildings as they appear on Ordnance Survey MasterMap and calculates whether they are detached, semi-detached, a terraced house or a new category of house type, a corner property. (For more information about the data and how you can download it, see this document). Once we were able to estimate the type of each house, it is possible to combine this with burglary data to work out how many burglaries occurred in the different types of properties. This would not be possible without the geospatial data because normally data of this type been aggregated. For example, we might know that there were 20 burglaries in a particular area, and there were 100 terraced houses and 50 detached houses in the same area, but we would not know how many burglaries occurred in each house type!

To determine some of the benefits of using our new geospatial data, we examined house type, burglary rates and information about community demographics from the Output Area Classification (OAC). City Living areas had consistently higher burglary rates than any other Super Group for each of the different property types. A detached property in City Living neighbourhoods was over four times more likely to be burgled than a detached property in parts of Leeds classified as Countryside and over three and a half times more likely to be burgled than a detached house in the Prosperous Suburbs.

City Living areas have a lot of privately rented property in them and younger single residents which often means that there are fewer people around during the day to keep an eye on things. This is what criminologists 'poor guardianship' and neighbourhoods like this are known to have higher levels of crime. These were clearly the types of area in Leeds most vulnerable to burglary.

Most property types in the Constrained by Circumstances social group had burglary rates that were more or less in line with the average for Leeds except for detached houses which were over two and a half times more likely to be burgled in these areas than in Leeds generally. There were also exceptionally low rates of burglary among terraced properties in Blue-Collar Communities and Prospering Suburbs all of which call for further investigation and, significantly, all of which would have been masked using conventional burglary rates.

Street Accessibility Analysis

The accessibility of each street segment (that is stretches of road between road junctions) to each other street has also been calculated from street network data (see the methods description for information about this method or this document to download street accessibility data). A measure of accessibility can be useful in crime analysis because it has been found to correlate with levels of vehicle or pedestrian traffic - highly accessible roads can expect higher volumes of traffic. Just as it was possible to look at differences in burglary rates by property type across the Super Groups, the GeoCrimeData Project has also made it possible to examine such differences in parts of Leeds that had been grouped together according to how busy the streets are.

Each street segment has been given a busyness score or what is technically called an 'Integration Value'. These integration values for all of the streets occupying each Output Area have then been added up and divided by the number of streets in each OA to give an average integration value. Once these have been calculated for each OA it is fairly straightforward to rank the OAs in decreasing order of their integration values and to identify the top 10% of OAs with the highest values (i.e. those having the busiest streets in Leeds), the next 10% of areas and so on until all OAs have been grouped together. We have defined 10 groups or deciles each containing 10% of OAs ranging from the top 10% (the busiest streets) through to the bottom 10% (OAs with the least busy/ most isolated streets) in Leeds.

This has enabled us to answer the question 'how do burglary rates in the most accessible areas compare with those in the least accessible areas?' and to go on to answer the more precise question 'how do burglary rates within each property type vary by street accessibility in Leeds?'.

Figure 1: Burglary rates by accessibility for detached houses
There appears to be a strong link between increasing levels of accessibility and burglary rates within detached houses. This is a positive relationship which means that the busier the streets, the higher the burglary rate (see Figure 1). With just two exceptions (Deciles 7 and 8) , the higher the decile the higher the burglary rate for detached properties. This suggests that detached properties were much more vulnerable if they were in more accessible streets. For example, detached houses were over three times more likely to be burgled in the most accessible 10% of OAs compared with the least accessible 10%; a major difference indeed!

Figure 2: Burglary rates by accessibility for terraced houses
Burglary levels of terraced properties were not quite as susceptible to increasing levels of accessibility compared with other house types. Burglary rates in the most accessible decile (10) were just under twice those in the least accessible decile (1). This can be seen in Figure 2.

Once again, these findings would not have emerged without bringing together different geospatial datasets.

Friday 14 October 2011

London street accessibility data

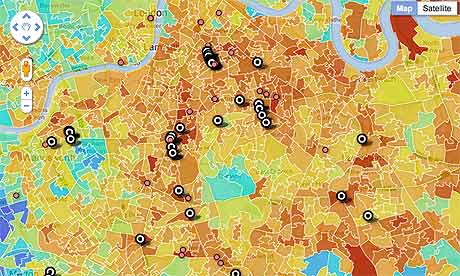
Just a quick note about our progress: we've recently made some significant advances to the data analysis software and have been able to calculate street integration (which is correlated to pedestrian/vehicle traffic) for London and other GB regions using Open Street Map. In the image below the red roads are supposedly the busiest.


Even though the algorithm is still being improved we can already start to pick out the main arterial routes which is encouraging (the algorithm doesn't know about the size of roads, just which ones are connected to each other). It is also promising that we can process such as large data set.

Thursday 13 October 2011

Publishing Metadata for Crime Analysis

One of the concerns among crime analysts that arose out of our meeting in September was that there is often little information provided about data that they might like to use. For example it might not be clear how it was produced (what assumptions were made), when it was produced, whether or not it is still relevant, how accurate it is etc. This makes the data difficult for professionals to use because unless they are confident in it they can't make any certain conclusions - this is particularly important because it might feed into crime reduction policy.

One of the ways round this problem is to use good metadata (data that describe data). So, to coincide with our beta data releases we have published associated metadata that describe how the roads and buildings were generated, when they were created, where they can be downloaded from, who can be contacted for more information etc. We made use of the GeoDoc tool (part of the GoGeo project) which made the whole process incredibly easy and we will continue to release metadata once the final products are ready. This also has the advantage that it's easy for people to find the data by using the GoGeo search tool:


Monday 10 October 2011

Making Open Data Real: A Public Consultation

The government are consulting on their forthcoming open data strategy:
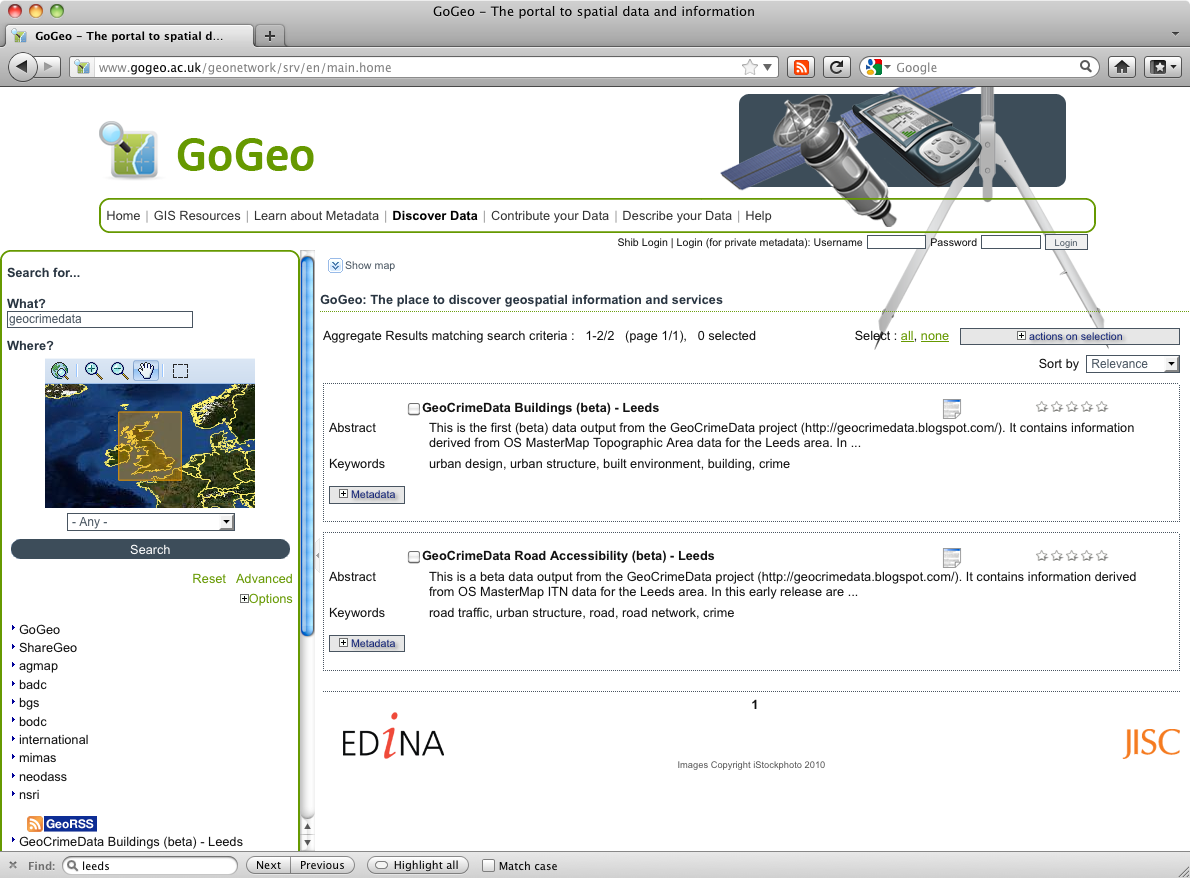
The Open Data consultation paper sets out Government’s proposed approach for Transparency and Open Data Strategy, which is aimed at establishing a culture of openness and transparency in public services. We want to hear from everyone – citizens, businesses, public services themselves, and other interest groups – on how we can best embed a culture of openness and transparency in our public services.  The consultation closes on 27 October 2011.
This is definitely something could benefit crime analysis, we going to put some serious thought into a response and I'd encourage anyone else who is interested to respond to the consultation.

Tuesday 27 September 2011

Beta geospatial data released

We have just released two initial ('beta') data sets. The data are:
  • A road network data set (available here http://hdl.handle.net/10389/207). The data contain a number of measures of road integration which can be used as a proxy for traffic volume.
  • A building (household) data set (available here: http://hdl.handle.net/10389/206). The data contain estimates of the house type (detached, semi-detached, terraced or flats), the number of neighbours in the surrounding area (50m and 200m buffers) and the size of any garden attached to the property.
Next Steps
At this stage the data are only available for Leeds and, as they have both been derived from OS MasterMap products, require special licences. Over the next few weeks we will improve the amount of information available in the data (to identify some of the factors that are more relevant to crime analysis) and also generate an Open Street Map data set that can be released publically.


Thursday 22 September 2011

Producers and consumers brainstorm the potential of geospatial data for crime analysis

On Tuesday 20th the GeoCrimeData Project ran a workshop attended by 16 crime analysis stakeholders who will ultimately form part of the main user group for the data that we produce. There was a healthy 50-50 split between people working in crime-reduction organisations and academic researchers interested in crime and the analysis of spatial data more generally. This eclectic group helped to ensure that the discussion about access to and use of geospatial data was stimulating, focused and embraced an unusually wide range of perspectives.


The core of the meeting consisted of a breakout session where the delegates were split into two groups (developers of geospatial data and potential users of data) to discuss:
  1. who might use the data and how they could use it
  2. what the barriers are to the uptake of geospatial data
  3. how these barriers can be overcome by developers.
The feedback was extremely useful for the project and will directly impact upon the spatial analyses that we perform and the ways in which we release and publicise the data. We are in the process of writing a summary about the barriers and solutions which will be relevant to many groups who use geospatial data, not just those interested in crime analysis.

Monday 22 August 2011

Mapping riot locations using publicly available data

Following the riots in England, the Guardian newspaper have mapped the locations of some of the people charged with related offences and have compared them to deprivation data (the Index of Multiple Deprivation). This is an interesting and extremely relevant use of publicly available data.


Thursday 4 August 2011

Project source code is available

We have just uploaded the Java source code for the GeoCrimeData project to a repository:

http://sourceforge.net/projects/geocrimedata/

At the moment the software is able to read in spatial data and calculate the mean path length for each road in a network. Mean path length is a measure of how easy it is to get from one road to every other road; roads with a low path length have been found to correlate with high vehicle and pedestrian traffic.

The image below shows the mean path length of roads using Open Street Map data for parts of Leeds, calculated using the software. It appears that 'major' roads (such as the motorway running through the centre of the map) have lower path lengths than the surrounding minor roads as we would expect (a low/green value indicates higher traffic volume). There are preliminary results and the software needs some tweaking, but hopefully a measure such as this should be a useful statistic for people who are interested in estimating how permeable/busy/accessible a street or neighbourhood is.


The next stages will be to improve the measure and run the software on UK data (rather than just a small area in Leeds).

Tuesday 5 July 2011

Results of a Survey of Crime Analysts

We have recently conducted a survey of ~30 eminent crime analysts from the UK and USA (as well as one person in Sweden!). The survey presented six maps which demonstrated some of the potential uses of geospatial data for crime analysts and asked the experts to give us their opinion on what they found useful/interesting about each of the new data sources.

 As an example, the figure left shows estimates of road traffic volume that were produced by looking at the structure of the local road network (using OS MasterMap data) and comparing this to occurrences of residential burglary. Analysts were asked whether they were familiar with this type of analysis, whether it would be useful for them to be able to easily access this type of data (or not) and how we might improve it.

The responses were extremely comprehensive and will be very useful in helping us to make sure that the products we produce will actually be useful to practitioners.

Monday 13 June 2011

Forthcoming conference presentations

We are going to a number of academic conferences in the coming months to present ongoing work on the project. The conferences that we'll be attending are:
  • Environmental Criminology and Crime Analysis (ECCA) in South Africa
  • European Society of Criminology (ESA) - 21st to 24th September 2011, Vilnius, Lithuania.
  • European Colloquium on Quantitative and Theoretical Geography (ECQTG) - 2nd to 5th September, Harokopio University of Athens, Greece.
  • Regional Science Association (RSAIBIS) - 6th to 8th September, Cardiff.
 For more information about the presentations, see the project homepage.

Monday 16 May 2011

Crime and the social mosaic

The very existence of geospatial data enables us to ask much broader questions about the context in which crime occurs. For example, rather than just identifying some areas as having higher crime than others we are able to move the discussion forward to ask questions about what types of area have high crime. Are they socially disadvantaged? Do they have high concentrations of particular types of housing? Are they student areas?

But geospatial data sets also enables us to ask questions about what is next to a particular area and what effect that might have on crime within an area. For example, do poorer areas have higher crime if they are also  surrounded by poorer areas? Do they have lower crime if they are next to affluent areas ? Do  affluent areas surrounded by disadvantaged areas have higher crime than affluent areas bordering middle or high income areas?. Geospatial data gives us the opportunity for the first time to explore the extent to which an area’s crime rate is affected not just by the crime risks within the area (i.e .the housing, natural surveillance, offender population and community cohesion) but by the characteristics of its neighbouring areas. This truly is breaking new ground!

Wednesday 13 April 2011

Initial data analysis

At this stage of the project we are investigating the types of spatial data that are available and how they might help to provide contextual information to supplement crime data. For example, the figure below shows some burglary rates in two areas that are very close to each other. We have used the OS MasterMap Topography layer and spatially analysed each of the buildings to try to work out whether they are terraced, semi-detached, flats or detached.

In general, more crimes are committed in the area labeled "B" than in "A". It also appears that the houses in area B are very similar to each other; most are terraced houses of similar design. Therefore it is possible that if someone is able to burgle one of the houses in area B, it is easier to burgle others as their design is so similar. The same is not true in area A which exhibits many different types of house design.

Of course there are a number of other explanations for the difference in the crime rates between the two neighbourhoods, but undoubtedly the physical environment will have an effect. Therefore this type of information might be extremely useful to crime analysts or other people who are interested in understanding the context behind crime rates. The GeoCrimeData project will continue to explore these types of data and perform analyses that might reveal interesting spatial information.

Wednesday 30 March 2011

Radio Interview with Professor Hirschfield

Alex Hirschfield was recently involved in a discussion about the new police.uk crime mapping website. The discussion was broadcast live on the Andrew Edwards Drive Live Show on BBC Radio Leeds at 5.30pm on 1st February 2011 and is available here.

During the discussion it becomes clear that although crime data is an essential part of the crime analysis toolbox, we cannot understand crime just by looking at crime data - we need to understand the 'context' within which crime occurs. Is there something about land use or the population out there in the 'environment' that might explain why crime levels appear to be high or low?

This is at the heart of the GeoCrimeData project, we will analyse existing environmental data (such as road networks and land-use datasets) to add context to observed crime patterns.

Tuesday 1 March 2011

Budget

The following table illustrates how the budget has been allocated

ItemAmount of budget allocated (%)
Staffing, estates etc.93
Dissemination (conferences) and travel7

Projected Timeline, Workplan & Overall Project Methodology

Work Packages

The project will progress according to the work carried out in the following work packages. Mark Birkin is responsible for the overall project methodology.

WP1: User geospatial awareness, needs assessment and initial data exploration

The initial stage in the project is to engage with end users to explore their awareness of geospatial data, current levels and types of use and future analytical needs. This will be carried out using an online questionnaire that will be circulated to academic institutions and practitioners (police, community safety partners etc). Concurrently, initial data exploration will take place in order to identify potential data sets that can be used in the project.  Andrew Newton and Nick Malleson are responsible for surveying users and collecting data respectively.

WP2: Data Access and the Creation of New High Resolution Data for EC and Crime Analysis


This stage will involve accessing relevant geospatial datasets and then analysing/modifying them to meet the needs identified in WP1. These tasks will require new methods to be developed in order to spatially analyse the input data sets and derive new data. Nick Malleson is largely responsible for WP2.

WP3: Case Study Pilot

WP3 will document a scientific case study using the data generated in WP2. The purpose of the case study will be to exhibit the new data sources to the community and demonstrate how they can be used to inform crime analysis. Andrew Newton is largely responsible for WP3.

WP4: Validation and Sustainability

The goal of WP4 is to evaluate the usability of the new datasets through interviewing stakeholders (identified in WP1). This is work will be carried out by Nick Malleson and Andrew Newton.

Work Package Timeline

Gantt chart depicting timescales of each work package

Project Team Relationships and End User Engagement

Mark Birkin

Mark Birkin is Professor of Spatial Analysis and Policy in the School of Geography at the University of Leeds.  He has wide-ranging leadership experience ranging from managing individual projects to institutional responsibilities. From 2001 until 2005 Mark was Director of the Institute for Interdisciplinary Informatics, and has also spent four years as leader of the Centre for Spatial Analysis and Policy. He is currently Director of External Relations in the School of Geography. Mark is the joint PI with Professor Mike Batty (UCL) of the GENeSIS node of ESRC‚’s National Centre for Digital Social Research, and is also director of the JISC project‚ Nationel e-Infrastructure for Social Simulation.  He is editor of the journal Applied Spatial Analysis and Policy, a member of the editorial board of Transactions in GIS, and a member of the JISC Geospatial Working Group. Mark is responsible for the overall management of the project; overseeing that the project-wide workplan is maintained.

Nick Malleson

Dr Nick Malleson (BSc Computer Science, MSc Geo-Informatics, PhD Geography) is a research fellow in the School of Geography at the University of Leeds and a member of the Centre for Spatial Analysis and Policy (CSAP). Dr Malleson’s research is interdisciplinary and centres around the development and application of spatio-temporal computational models in the social sciences. His recently completed doctoral research implemented a complex micro-level model which used geospatial data and artificial intelligence to predict and explore occurrences of residential burglary in real cities. Nick’s role will centre around data capture, data analysis and the production of software tools.

Alex Hirschfield

Alex Hirschfield is Professor of criminology and Director of the University of Huddersfield's Applied Criminology Centre. He has over 30 years' experience in research and consultancy and has led large scale national evaluations for the Home Office (burglary reduction), Neighbourhood Renewal Unit (crime and regeneration) and Youth Justice Board (Preventing Violent Extremism). As a former geographer (BA and PhD from Leeds) who became a criminologist, Alex is in an ideal position to see the connections between both disciplines. Over the years he has developed a number of conceptual and analytical frameworks that identify both the end users of geospatial data sets for crime analysis and the potential uses of such data. He was one of the first to apply crime hotspot techniques to British police data in the early 1990s in an ESRC funded project and went on to develop a system for producing social, land use and demographic profiles for high crime areas. Alex is well-known in the Environmental Criminology academic community and as a member of the AGI’s Crime and Disorder Special Interest Group and a former Senior Home Office Adviser to Government Office Northwest, has strong connections with practitioners and end users. His role in the JISC Project will be to oversee the criminological aspects of the work, develop appropriate theoretical frameworks for the research and draw upon his external links to engage with the user community. To see how he gets on, just watch this space!

Andrew Newton

Dr Andrew Newton (BSc Geography, Msc GIS. PhD Environmental Criminology) has 11 years research experience in environmental criminology and expertise in working with geospatial data for research and policy evaluation projects using Geographical Information Systems. One of his key research interests is the geography of crime,  and he secured funding in this area from a number of sources including the Home Office, Alcohol Education Research Council, Department for Transport Merseyside PTE, EPSRC, ERDF (EU), Government Office North West and the Alberta Gaming and Liquor Commission (AGCL, Canada). He has published widely in the field and has presented at over fifty national & twenty-five international conferences. His role will be to develop and analyse internet based survey to establish the current levels of awareness and interest exists in mapping crime and using geo-spatial data, to identify the user needs of this community, and liaise closely with these organisations and stakeholders in the development of this project .